Resources
"The Devil Ties My Tongue" by Amy Seiwert performed for the SKETCH Series, 2013. Photo by David DeSilva. Courtesy of Amy Seiwert's Imagery
December 31st: Jacob's Pillow: Ann & Weston Hicks Choreography Fellows Program, December 31st: New England Presenter Travel Fund, December 31st: Central Pennsylvania Youth Ballet Scholarship, December 31st: 24 Seven Dance Convention, December 31st: National Theater Project Presenter Travel Grant, December 31st: Breck Creek Artist-in-Residence Program, December 31st: Indigo Arts Alliance Mentorship Residency Program, January 22nd: Opera America Grants, March 3rd: Dance | NYC: Dance Workforce Resilience (DWR) Fund, March 31st: SIA Foundation Grants
×
"The Devil Ties My Tongue" by Amy Seiwert performed for the SKETCH Series, 2013. Photo by David DeSilva. Courtesy of Amy Seiwert's Imagery
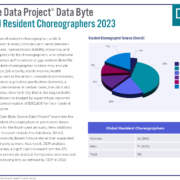
With this Data Byte, Dance Data Project® examines the role of resident choreographers at prominent dance companies for the fourth year annually. New additions to this year’s report include the Additional 50 U.S. Ballet & Classically Based Companies and an expanded global company sample. As a result, DDP analyzes 348 companies, a significant increase from the 270 companies previously studied.
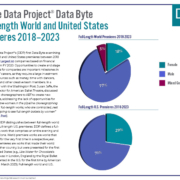
This is Dance Data Project®‘s (DDP) first Data Byte examining full-length world and United States premieres between 2018 and 2023 by the Largest 50 companies based on financial expenditure from FY 2020. Opportunities to create and stage full-length works for companies are important milestones in choreographers’ careers, as they require a large investment of company resources such as money, time with dancers, costumes, sets, and other creative team members.
The third annual Leadership Transitions Data Byte is a short form analysis that provides a detailed breakdown of role transitions for artistic directors, executive directors, associate artistic directors, and resident choreographers at dance venues, ballet companies, modern/contemporary companies, and prominent schools/conservatories which occurred in 2022 or have been announced for 2023 and later.
This report is an expansion from the Artistic Director Leadership Changes 2021+ Data Byte, which solely focused on artistic director transitions within dance companies. This year’s Data Byte also highlights directors who began as interim/acting directors and are now or will be promoted to a permanent leadership role between 2022 and 2024 (these directors are only counted once).
Dance Data Project® has released the second full First Look report, examining the gender distribution of choreographers for the Largest 150 U.S. ballet and classically influenced companies in the current 2022-2023 season. Previously, the First Look report has been included as part of DDP’s Season Overview report. However, as DDP continues to expand our research from examining the Largest 50 companies to the Largest 150 companies, a second report was needed to include the most detailed findings.
Overall, DDP found that the Largest 150 companies are continuing to program more works choreographed by men, consistent with the past four seasons of research. Of 1075 announced works for the 2022-2023 season amongst the Largest 150 U.S. ballet and classically influenced companies, 27% are choreographed by women, which is a further reduction compared to the 2021-2022 season (29% choreographed by women).
When closely examining the types of programmed works, DDP found that only 21% of full-length works programmed for the 2022-2023 season by the Largest 150 companies are choreographed by women.
This Data Byte examines artistic & executive director reportable compensation increases (or decreases) in relation to the overall budget of the Largest 50 U.S. ballet and classically inspired companies. The COVID-19 pandemic greatly impacted the operations of many dance companies, and caused a wave of both cancellations and the furloughing of many dancers. This Data Byte takes an initial dive into the fiscal interactions between company budget and company leadership compensation from fiscal year 2016 to fiscal year 2020.
The following report is Dance Data Project® (DDP)’s fourth annual Season Overview Report and analyzes the gender distribution of choreographers programmed by the largest 150 U.S. ballet and classically inspired companies between August 2021 and August 2022. This report is DDP’s most expansive to date and examines the Largest 150 U.S. ballet and classically influenced companies, compared to only the Largest 50 in previous reports.
Dance Data Project®’s latest Dance Venue Leadership & Programming Report examines 73 leading ballet/classically inspired dance performance venues in the United States to provide quantitative analysis of the organizations’ programming and leadership equity. Programming data for these venues is collected from open sources (primarily venue and company websites) for the 10-month period from October 2021 through July 2022. This report is an extended and updated version of the original 2020 Dance Venue Leadership & Programming Report that was produced in collaboration with the Center for Equity, Gender, and Leadership (EGAL) at UC Berkeley’s Haas School of Business.
Dance Data Project®’s (DDP) fourth annual Artistic and Executive Leadership Report is the most comprehensive study to date. For the 2022 Report, the DDP research team produced two parts. The first, Largest 150 U.S. Ballet & Classically Based Companies & Financial Scope of the Industry, was published in June 2022 and listed the Largest 50 U.S. ballet companies, ordered by budget, as well as the Next 50 and an Additional 50 for a total of 188 companies surveyed to rank 150. The Largest 150 U.S. Ballet & Classically Based Companies & Financial Scope of the Industry also detailed the combined expenses of the Largest 50, Next 50, and Additional 50 and revealed that aggregate expenditures for the Largest 50 companies dropped by almost 12% from the previous year, totaling $586,724,176. The aggregate expenditures for the Next 50 totaled $44,519,966, almost 8% of the Largest 50 in FY 2020.

The following is Dance Data Project®’s fourth annual and most comprehensive study to date of the largest U.S. ballet companies. For the 2022 Report, the DDP research team produced rankings by size not only for the Largest 50 and Next 50, but also an Additional 50, thus ranking a total of 150 U.S. ballet companies. The Largest 150 U.S. Ballet & Classically Based Companies & Financial Scope of the Industry Report gives information on the aggregate expenditures of all three groups, demonstrating the considerable economic contribution of the classical dance economy, as well as the significant disparity in size between the largest few companies and the rest.