Resources
"The Devil Ties My Tongue" by Amy Seiwert performed for the SKETCH Series, 2013. Photo by David DeSilva. Courtesy of Amy Seiwert's Imagery
December 31st: Jacob's Pillow: Ann & Weston Hicks Choreography Fellows Program, December 31st: New England Presenter Travel Fund, December 31st: Central Pennsylvania Youth Ballet Scholarship, December 31st: 24 Seven Dance Convention, December 31st: National Theater Project Presenter Travel Grant, December 31st: Breck Creek Artist-in-Residence Program, December 31st: Indigo Arts Alliance Mentorship Residency Program, January 22nd: Opera America Grants, March 3rd: Dance | NYC: Dance Workforce Resilience (DWR) Fund, March 31st: SIA Foundation Grants
×
"The Devil Ties My Tongue" by Amy Seiwert performed for the SKETCH Series, 2013. Photo by David DeSilva. Courtesy of Amy Seiwert's Imagery
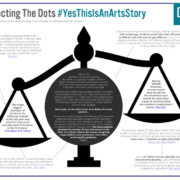
Connecting the Dots is an ongoing campaign by DDP to advocate for the acknowledgment of the pandemic’s effect on women in the arts by policy makers, journalists, and funding organizations. DDP’s April 2021 databyte sourced over 60 articles and studies to reflect the generational suffering of women at the expense of COVID 19’s global impact. This year’s Data Byte dives deeper into this narrative, highlighting the pandemic’s even stronger hold on women as men have now completely recouped all their workforce losses.

This Report, DDP’s third annual report on dance festivals, shows that women choreographed 48% of the works programmed at the dance festivals sampled. The percentages of live works and world premieres choreographed by women, however, are both lower, 38% and 36% respectively, indicating that women remain less likely to receive the most coveted types of commissions.
The Report also shows that 69% of the sampled festivals were led by women in the role of artistic director or equivalent, and that the festivals led by women had on average a higher gender equity score in performance programming than the festivals led by men (0.49 compared to 0.38), meaning that festivals led by women are more likely to program works choreographed by women.
Dance Data Project® enters the world of academia with this report focused on gender equity among faculty and administrators at degree-granting collegiate dance programs. This Report explores the post-secondary academic world of dance, analyzing the gender distribution of faculty, their positions, and their level of academic achievement. The Report also examines the gender distribution of academic administrators overseeing the dance programs, those faculty members whose policies and power directly impact the lives of faculty, from master’s candidates to full professors.
The Report analyzes 781 full-time and 819 part-time dance faculty positions, as well as 224 administrative positions at 173 public and private degree-granting collegiate dance programs in the U.S. It shows that women clearly outnumber men in dance faculty, and women also hold advanced degrees (master’s or doctoral) at a higher rate than men. However, within those holding advanced degrees, a higher percentage of the men occupy full-time positions. Men are also more likely to hold the prestigious role of dean than women.

With this Data Byte, Dance Data Project® examines the role of resident choreographers at prominent dance companies for the third year annually. For the first time, this research analyzes 270 companies, a significant increase from the 143 companies previously studied.
For this study, Dance Data Project® compiled a list of 125 ballet companies, supplemented by DDP’s list of the Largest 50 U.S. Ballet Companies, which is updated annually and published in the Artistic and Executive Leadership Report. Together, this is a sample of 175 ballet companies from 56 countries, representing the most prominent ballet companies around the world. To combat the Eurocentrism of ballet and DDP’s own bias as a U.S.-based organization, additional time was given to researching ballet companies in Asia, Africa, South America, and Central America. DDP advisors were also consulted to provide as complete a survey as possible.
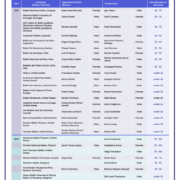
This Data Byte details artistic director changes at ballet companies globally which occurred in 2021 or have been announced for 2022 and later. The highlighted rows indicate companies which have announced the departure of their artistic director but have not named a successor as of December 6, 2021.
Companies are grouped by year of leadership change and ordered categorically by size and then alphabetically by name.
A version of this Data Byte was also published as the Appendix in DDP’s Global Ballet Leadership Report. To learn more about the data and report methodology, view the Global Ballet Leadership Report.
This Report expands the scope of Dance Data Project®’s research to examine, for the first time, the largest U.S. contemporary and modern dance companies. Past research by Dance Data Project® (DDP) has examined various aspects of the dance industry with a lens of gender equity, including leadership and programming at the largest ballet companies, dance festivals, venues presenting dance, and more. This is DDP’s first study which explicitly looks at contemporary and modern dance companies.
The Report finds that the Largest 50 U.S. contemporary and modern dance companies operated with aggregate expenses of about $150 million in fiscal year 2019. For context, in the same year, the Largest 50 U.S. ballet companies operated with aggregate expenses of about $664 million, showing an extreme disparity in available resources.
The Report also shows the even gender distribution of current Artistic Directors at the Largest 50 U.S. contemporary and modern dance companies (50% women and 50% men), as well as the gender distribution of company founders (54% women and 46% men), and the average age of companies (37 years).
The following Report is Dance Data Project® (DDP)’s third annual Season Overview Report and analyzes the works programmed by the Largest 50 U.S. ballet companies between August 2020 and August 2021, specifically focusing on the gender distribution of choreographers.
DDP found, for the third consecutive year, that the majority of work was choreographed by men. Men choreographed 69% of the works programmed in the 2020-2021 season, a slight decrease from 72% in the previous season and 81% the season before. In comparison, women choreographed 27% of works, and 4% of works were choreographed by co-choreographers of different genders and/or gender non-conforming choreographers.
Encouragingly, programmed works by women have increased by 10% since DDP’s first Season Overview Report, which analyzed the 2018-2019 season.
The Report also analyzes the number of individual choreographers and groups of co-choreographers whose work was programmed in the 2020-2021 season. DDP recorded 447 unique choreographers/groups of co-choreographers, of whom 60% were men. The two choreographers whose work was programmed by the largest number of companies were George Balanchine and Marius Petipa.
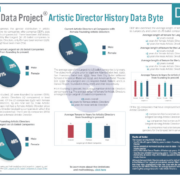
Dance Data Project® (DDP) presents Data Byte: Artistic Director History, a mini-report providing a breakdown of the gender distribution in artistic leadership among the 50 companies who comprise DDP’s 2021 Largest 50 US Ballet Companies. The data for the mini-report was sourced from company websites, news articles, and press releases and is the first Report from DDP to examine gender distribution in US ballet companies as far back as company foundings.
The following Report is the third annual Dance Data Project® Artistic and Executive Leadership Report and the most comprehensive study to date. For the 2021 Report, the research team produced two parts. The first, Largest 50 U.S. ballet companies and Scope of the Industry, was published in May 2021. This second Report examines the leadership positions at the Largest 50 and Next 50 U.S. ballet companies and compares the number of men and women in the roles, as well as their respective compensation. The Report goes further to give year-by-year comparisons and further insight into the highest compensated employees at the ballet companies with the largest operating budgets.