Largest 150 U.S. Ballet and Classically Based Companies 2026
November 11th, 2026
November 23rd: Camille A. Brown and Dancers Mentorship Program, November 27th: Peripheral Vision International Photography and Film Festival, December 1st: Culture Forward Grant - The Svane Family Foundation Deadline 3, December 1st: Harkness Foundation for Dance Program/Project Grant, December 2nd: NYS Choreographers Initiative (NYSCI), December 7th: Dance Astoria: Call for Queens-Based Choreographers, December 31st: National Dance Project Presentation Grants - New England Foundation for the Arts, December 31st: National Dance Project Travel Fund, December 31st: New England Presenter Travel Fund, December 31st: Kit Modus In-person Choreographic Residency, December 31st: Gross Family Prize: Charles and Joan Gross Family Foundation, December 31st: Foundation for Contemporary Arts Emergency Grants, December 31st: Fertile Ground 2026-2027 Season, December 31st: WestFest: Top Floor 2027, December 31st: WestFest: All Over Westbeth 2027
×
November 11th, 2026
This is the eighth annual study of the Largest 150 U.S. Ballet and Classically Based Companies. DDP reviewed 215 companies, ranked the 193 qualifying nonprofit companies with Fiscal Year 2024 (FY24) financial data, and analyzed the finances of the Largest 150 by expenditure and revenue. The report offers transparent, data-driven insights into the economic realities and ongoing challenges facing the dance sector.
For the second consecutive year, DDP finds more companies operating at a deficit than a surplus. The report also highlights meaningful differences among the Largest 50, Next 50, and Additional 50 companies, based in part on a recalculation of prior years’ data that incorporates previously unavailable information.
Report Lead Junyla Silmon says, “Our research team is 100% focused on developing more sophisticated reports while streamlining our processes. DDP researchers expanded the pool of companies considered, conducted deeper analyses of financial data (particularly net income), strengthened outreach efforts to ballet companies, and introduced updated methodologies to unify historical data with modern-day findings, making the 2026 report the most formidable to date.”
In addition to examining FY24 and preliminary FY25 data, the 2026 report includes recalculated FY18-FY23 expenditure and revenue aggregates for the Largest 50, Next 50, and Additional 50 ballet companies, reflecting the most up-to-date information on the industry’s economic landscape.
DDP has determined that company 990s are not always available between data collection and report publication, so DDP excludes those companies from that year’s report. To present the most accurate assessment of the sector’s financial standing, DDP has recalculated company aggregates to include previously missing financial data and has updated past rankings using the same data. While the 2026 report presents the most current aggregates and rankings for FY18-FY23, past reports remain as recorded at the time of their publication. Companies removed this year remain in the years in which they were ranked, and companies removed in earlier reports remain removed.
In FY24, the Largest 150 companies operated with an aggregate expenditure of $885,724,323, an increase of 6.58% from FY23’s total expenditure of $831,053,461. This marks a third year of growth following the sharp contraction of FY20–FY21, though the rate of growth has slowed (from 63.36% in FY21-FY22 and 15.43% in FY22-FY23), suggesting a continued return to “normal” or at least an alignment with pre-COVID levels. The pre-pandemic growth rate in expenditure (FY18-FY19) was 4.50%.
Research Lead Isaac Garcia emphasizes the importance of DDP’s seminal report. “This study is the foundation of DDP’s research on ballet. It defines the companies we examine in the ballet reports that follow, from leadership to programming to compensation. This year’s data describes a sector that has recovered in scale but not in stability.”
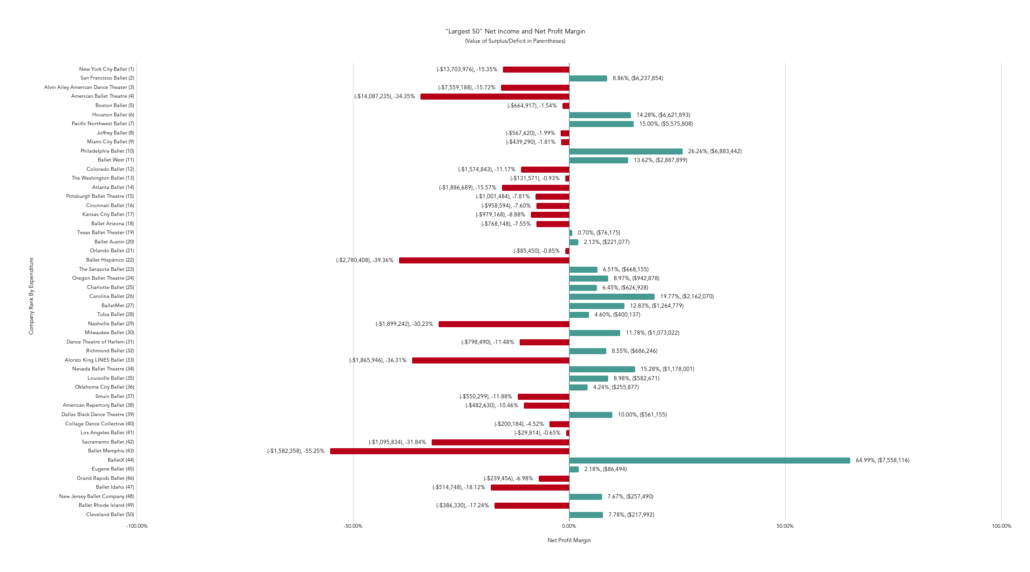
The Largest 150’s overall profitability remains unevenly distributed. Of the 150 companies ranked in FY24, 66 (44.00%) finished with a surplus, whereas 84 (56.00%) finished with a deficit, signaling that financial recovery remains inconsistent across the field. Companies in deficit are up from FY23, when 68 companies (45.33%) finished with a surplus and 82 companies (54.67%) finished with a deficit. DDP examines net profit margin (net income divided by total revenue) to measure the size of a company’s surplus or deficit relative to its revenue. In FY24, 49 of the 150 companies (32.67%) had a net profit margin between -5% and +5%, meaning their surplus or deficit was within 5% of revenue and they operated relatively close to break-even.
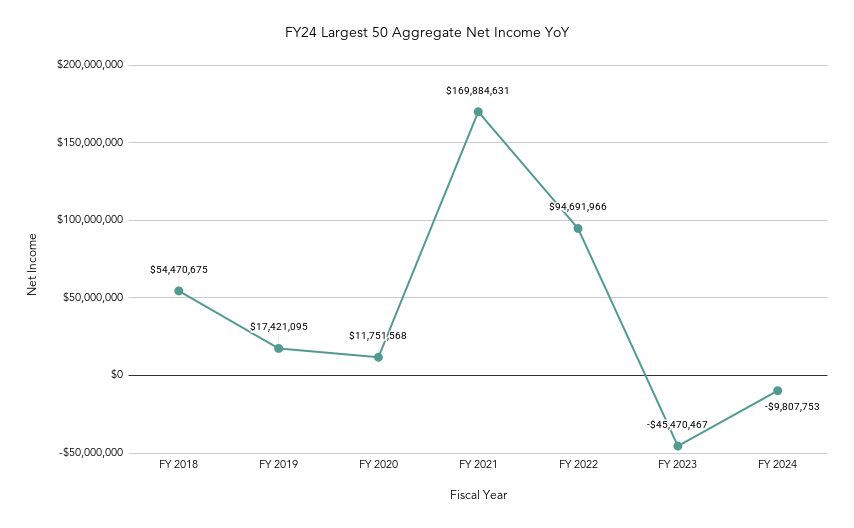
The Next 50 was the only group to finish FY24 with an aggregate surplus ($650,039), though it had the fewest number of companies in surplus. The Largest 50 and Additional 50 had an aggregate deficit of –9,807,753and-202,231, respectively.
Programming Note: This report is our first fully web-based layout. Graphs and charts are now fully interactive, simply hover over the elements for a more detailed breakdown.
DDP’s President and Founder Elizabeth (Liza) Yntema comments, “Dance Data Project® is a small organization with a tiny dedicated team. Within these limitations, we continuously break new ground in both how we report and what we report on. This includes restructuring this report to put surplus and deficit first, as we heard from the industry that net income was the most pressing information. This shift in reporting clarifies companies’ operational standing and gives donors and boards actionable information. We analyze, we listen, we regroup, and we do it even better the next time.”