

DANCE DATA PROJECT® RELEASES 6TH ANNUAL COMPENSATION REVIEW OF THE LARGEST 150 U.S. CLASSICAL BALLET COMPANIES, DETAILING NUANCED SHIFTS IN GENDER-BASED PAY EQUITY
Northbrook, IL | March 31, 2026 | Dance Data Project® (DDP) announced publication of its annual Ballet Artistic and Executive Compensation Report. President and Founder Elizabeth (Liza) Yntema notes that this is the 70th report DDP has published, occurring just over 7 years after the publication of the first DDP study. She states, “DDP continues to produce groundbreaking research that highlights shifts in the dance landscape and the gender inequities that persist in the field. Every new study teaches us, and the field, something more.” This iteration again examines pay in the Largest 150 ballet and classically based companies in the U.S., ranked by annual expenditure.
Among the Largest 50 companies, in FY2024, artistic directors earned an average of $240,741. This represents an increase compared to FY2023, during which the average compensation was $227,650. In contrast, average executive director compensation decreased from $229,791 in FY2023 to $204,744 in FY2024. Research Lead Jenna Magrath explains, “The large year-over-year change may be due to several factors, including retirements, transitions, or partial-year salaries.”
The average compensation for female artistic directors in the Largest 50 companies in FY2024 was $234,080, while the average compensation for their male counterparts was $239,785. As seen in Figure 1, pay equity improved among the artistic directors of the Largest 50 companies in FY2024; Female artistic directors earned 2 cents less per dollar than their male counterparts, compared to earning 24 cents less per dollar in FY2023.
Figure 1:
Largest 50 – Female Artistic Directors Earnings and Pay Gap
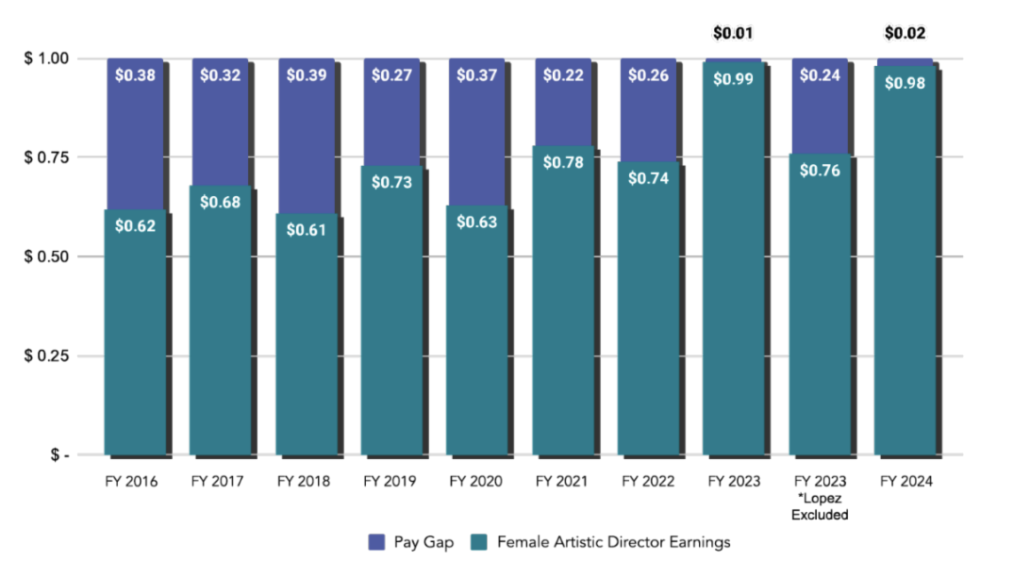
NOTE: Lourdes Lopez (female), former artistic director of Miami City Ballet, represents a significant outlier and was paid $1,093,938 in FY2023. When her compensation is included in gender pay gap calculations, female artistic directors within the Largest 50 earned 1 cent less than their male counterparts in FY2023.
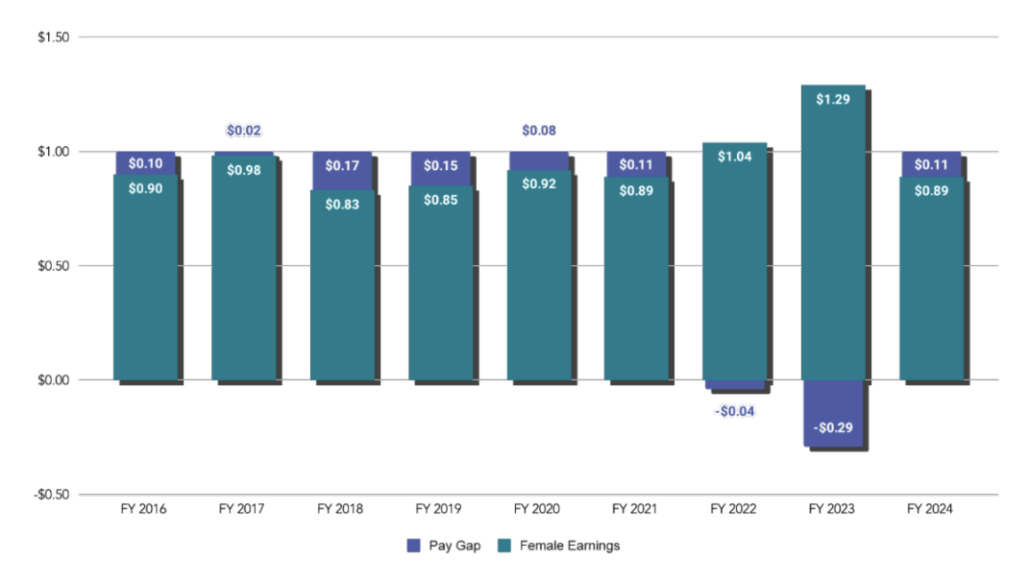
In contrast, female executive directors of the Largest 50 companies earned an average of $189,696, while their male counterparts earned an average of $213,925. This marks the first year that female executive directors earned less than male executive directors since FY2021.As seen in Figure 2, pay equity among the executive directors of the Largest 50 companies noticeably decreased. Women earned 11 cents less per dollar compared to their male counterparts in FY2024, whereas in FY2023, women earned 29 cents more per dollar.
Figure 2:
Largest 50 – Female Executive Directors Earnings and Pay Gap
Within the Largest 50 companies, artistic directors’ and executive directors’ pay represented a significant portion of the company’s annual expenditure (for FY2024, 2.00% and 1.99% respectively). In FY2024, 39 companies operated at a deficit yet increased their artistic director’s compensation. This continues a trend noted in FY2023, where 30 companies in deficit increased their artistic director’s compensation. 31 companies operating in a deficit increased their executive director’s compensation in FY2024, compared to 30 companies in FY2023. Changes in compensation were notably variant: some leaders received salary increases between 50.0% and 300.0%, and others took cuts of over 25.0%.
The report also analyzes gender & compensation trends among the Next 50 largest companies, and the Additional 50 largest companies, ranked by annual expenditure. The report structure continues to offer compensation analysis by budget tier for benchmarking purposes and to show trends in compensation related to expenditure. External Communications Lead, Nancy Dobbs Owen, notes, “Funders and artists are relying on this data to help assess the long-term viability both of individual companies and the sector as a whole. For smaller companies seeking accurate pay information, we hear over and over that this resource is invaluable.”
Ms. Magrath shares, “We are immensely grateful to the 38 companies that self- reported compensation data for their commitment to transparency and contribution to a more equitable pay landscape. This information is essential to capture a more accurate picture of pay in the ballet industry. It also helps smaller companies compare their compensation against similarly sized companies, which is considered best practice in determining appropriate compensation levels.”
The findings in this report show an industry trend mirrored in the Contemporary and Modern Compensation Data Byte released earlier this month. This report showed equity was highest in the largest companies (controlled for outliers) and in the smallest companies, with mid-sized companies showing significant pay discrepancies between male and female leadership.
NOTE: This analysis presents descriptive averages of publicly available financial data from the IRS and ProPublica. It does not control for important variables, including tenure, prior experience, geographic location, workload (particularly for combined roles like CEO/AD), or organizational structure.
Ms. Yntema adds, “Dance Data Project® is dedicated to illuminating where real progress is occurring. We focus on the entire industry, not just the largest, best-known companies operating in big cities. Data in dance is our tool to illuminate imbalance and advocate for pay equity in all sectors.”
The Ballet Artistic and Executive Compensation Report is available for download on the Dance Data Project® Research Page.

 People's Summit, Photo by Midia Ninja